
Why Distribution is Important and How to Manage it
What is distribution and why does it matter
High Distribution
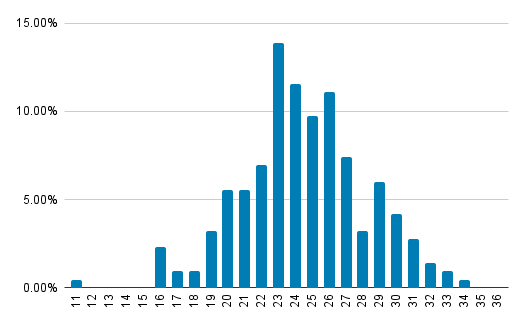
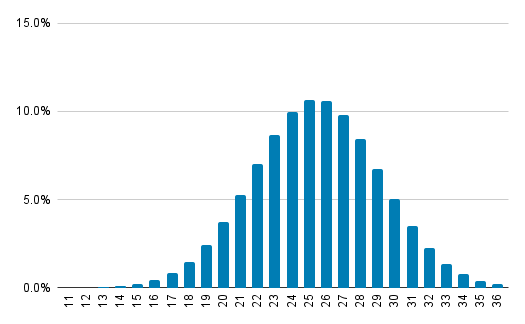
Shrimp farming requires getting an accurate measurement of the average weight of shrimp in the pond to understand growth and plan feed, however the average weight doesn’t tell the whole story of the pond. The graph below shows two ponds with the same average weight, but very different distributions:

In order to truly understand the shrimp in a pond, the distribution of weights must be taken into account. When distribution is considered and managed, it results in a more efficient and profitable production.
A high distribution of sizes is always indicative of a problem, especially early in the cycle. It can indicate that the PLs are poor quality, that the shrimp are not being fed evenly which will lead to a lower survival rate, that the pond is reaching carrying capacity, or even act as a leading indicator for disease.
A high distribution can indicate various issues throughout the cycle.
0-5g: the animals may not be feeding at similar rates in the pool, which can lead to lower survival rate
5-15g: suboptimal feeding leads to additional complications. Growth may be slowing because of underfeeding, or excessive feeding may lead to water quality issues
15g and up: harvests may need to be delayed if target weights are to be met, which can result in costly lengthier cycles
At the plant: processing a harvest with many different sizes of shrimp takes more time, and can eat into the profitability for the farm
Skewed Distribution
The shape of the distribution histogram shows if a population has more shrimp above or below the average weight. When the histogram is skewed to the left, it means that at processing time more shrimp will be classified in smaller commercial classes. Through the previously mentioned feeding strategies, skew can be corrected. In the example above, this brought in an additional 4.5 cents / pound at harvest time, without changing the average weight.
Additionally, when close to the desired harvest weight, the distribution can give a clear breakdown of what commercial classes will be harvested from the pond, and therefore a more ideal harvest date can be selected.
What happens when distribution is managed well
When managed well, maintaining an optimal distribution can lead to many benefits, including:
Reduction of FCR
Shortening of cycle length
Reduction of cost of production
Increased profitability
Working with a 300Ha farm in Ecuador over the course of two years to take decisions to manage distribution, significant improvements were experienced.
14% increase in survival rate
18% increase in growth
$0.17 / lb increase in profit, based on an average sale price of $1.55 / lb
How xpertSea helps achieve these results
xpertSea’s computer vision allows for quick measurement and quantification of distribution, which historically has either been done qualitatively or not at all. The computer vision calculates the weight in seconds for every shrimp in the sample, which yields a graph like this:

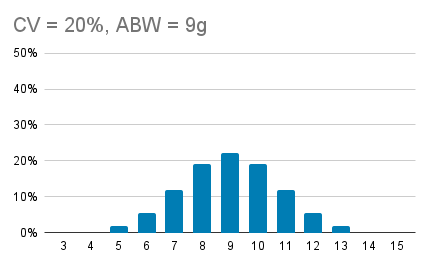
This graph is very useful, but xpertSea provides additional insight by summarizing and quantifying how distributed the pond is in a single number: the Coefficient of Variation, or CV. The higher the CV, the more sizes of shrimp there are in the pond. To visualize how CV impacts a distribution, take the following graphs as an example. They all have the same average body weight, but tell a very different story about the contents of the pond. From left to right, they have a CV of 10%, 20%, and 30% which demonstrates visually how CV is able to simply capture the distribution into a single number:


What decisions can be taken based on distribution?
Some examples of decisions that can be made based on the distribution information of a pond are:
Pellet mix: By analyzing the entire population, the appropriate feed pellet sizes can be given to ensure all of the shrimp in the pond are able to feed.
Identification of health issues: using distribution information as a leading indicator for the health of the animals, it can act as an early warning sign to have shrimp sent to a lab for testing.
PL Quality: Understand the quality of larvae by monitoring the distribution and understand which labs are providing the best quality PLs
Feed strategy optimization: Over time understand how experiments yield results to improve distribution. Use the distribution to change feeding zones and observe performance within days
Partial Harvest planning and Carrying Capacity Detection: When distribution begins to rise partway through the cycle, it can be an indication that the pond is reaching its carrying capacity and needs to be partially harvested.
Harvest planning: Understand the commercial classes that will be harvested throughout the cycle helps better plan for negotiation with processors.
For more information see our article in Revista Acuacultura or to bring xpertSea MAX to your farm, contact us at info@xpertsea.com